
We recently modeled three proposed hires for a single-owner captive agency. The owner wanted to know whether the agency could support all three in 2026, how much risk came with hiring them at once, and what each person would need to produce.
We reviewed the agency’s January through May 2026 cash-basis actuals and modeled each hire individually and as a group. The identifying details have been removed, but the decision is one nearly every growing agency faces at some point.
The P&L may show enough profit to support another hire, but profit alone does not tell the full story. The decision also depends on recurring earnings, the fixed payroll commitment, the commission structure, and cash flow..png?width=929&height=364&name=blog-img-1-hero%20(2).png)
Setup
The data we worked with
We worked with five months of cash-basis actuals, January through May 2026, for an agency considering three specific hires. Revenue and operating expenses were clean, and the results tied back to the balance sheet.
The agency recorded $28,195 of its $29,445 annual carrier bonus in February. Because that income only arrives once a year, we ran the analysis two ways: as reported and on a run-rate basis with the bonus excluded. Every hiring scenario below uses the run-rate basis so the decision is based on recurring performance, not one unusually strong month.
The Engine
The numbers we used to evaluate the hires
Through May, the agency generated $546,125 in revenue and $120,208 in net income. That result tied closely to the current-year earnings reported on the balance sheet.
After removing the annual carrier bonus, the agency’s recurring monthly performance looked like this:
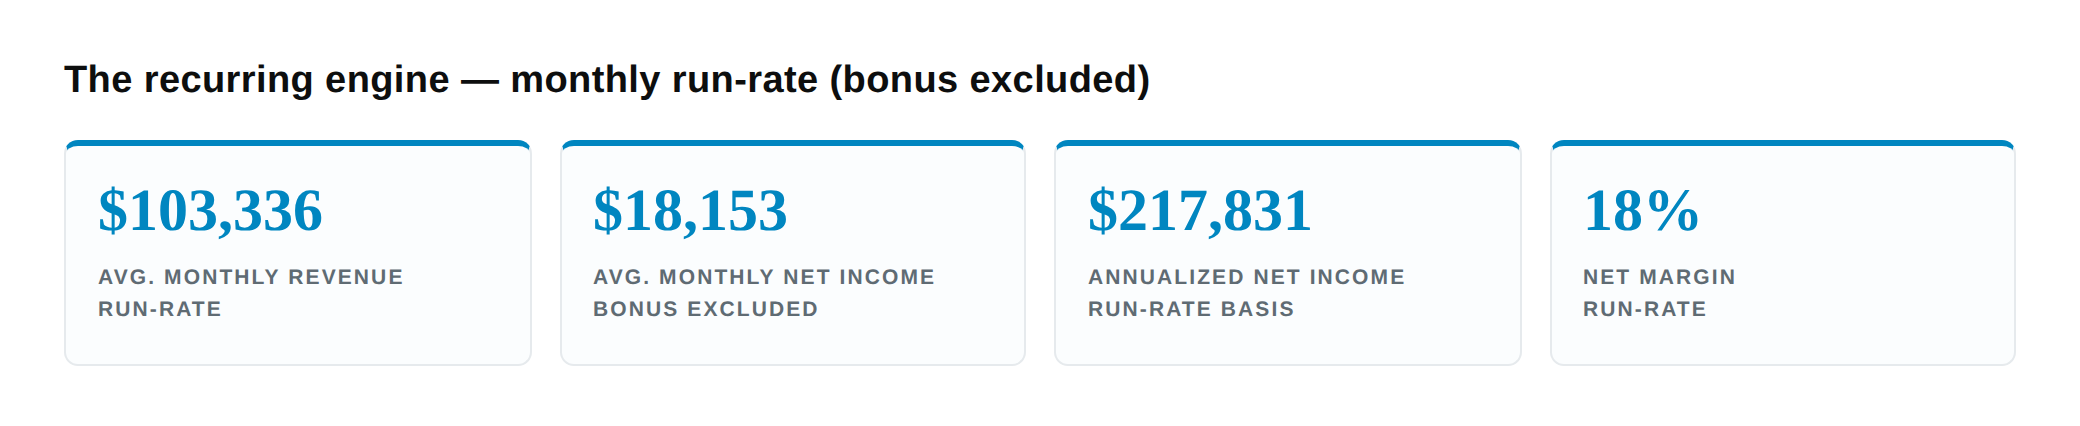
The $217,831 annualized figure became the baseline for the hiring analysis. It reflects what the agency is producing through normal operations, without relying on the carrier bonus to cover ongoing payroll.
The Hires
The agency’s fixed payroll commitment
The three proposed roles carried base salaries of $35,000, $32,500, and $55,000, or $122,500 combined. We added 25% for payroll taxes, health insurance, and other benefits, bringing the total loaded base to $153,125 a year.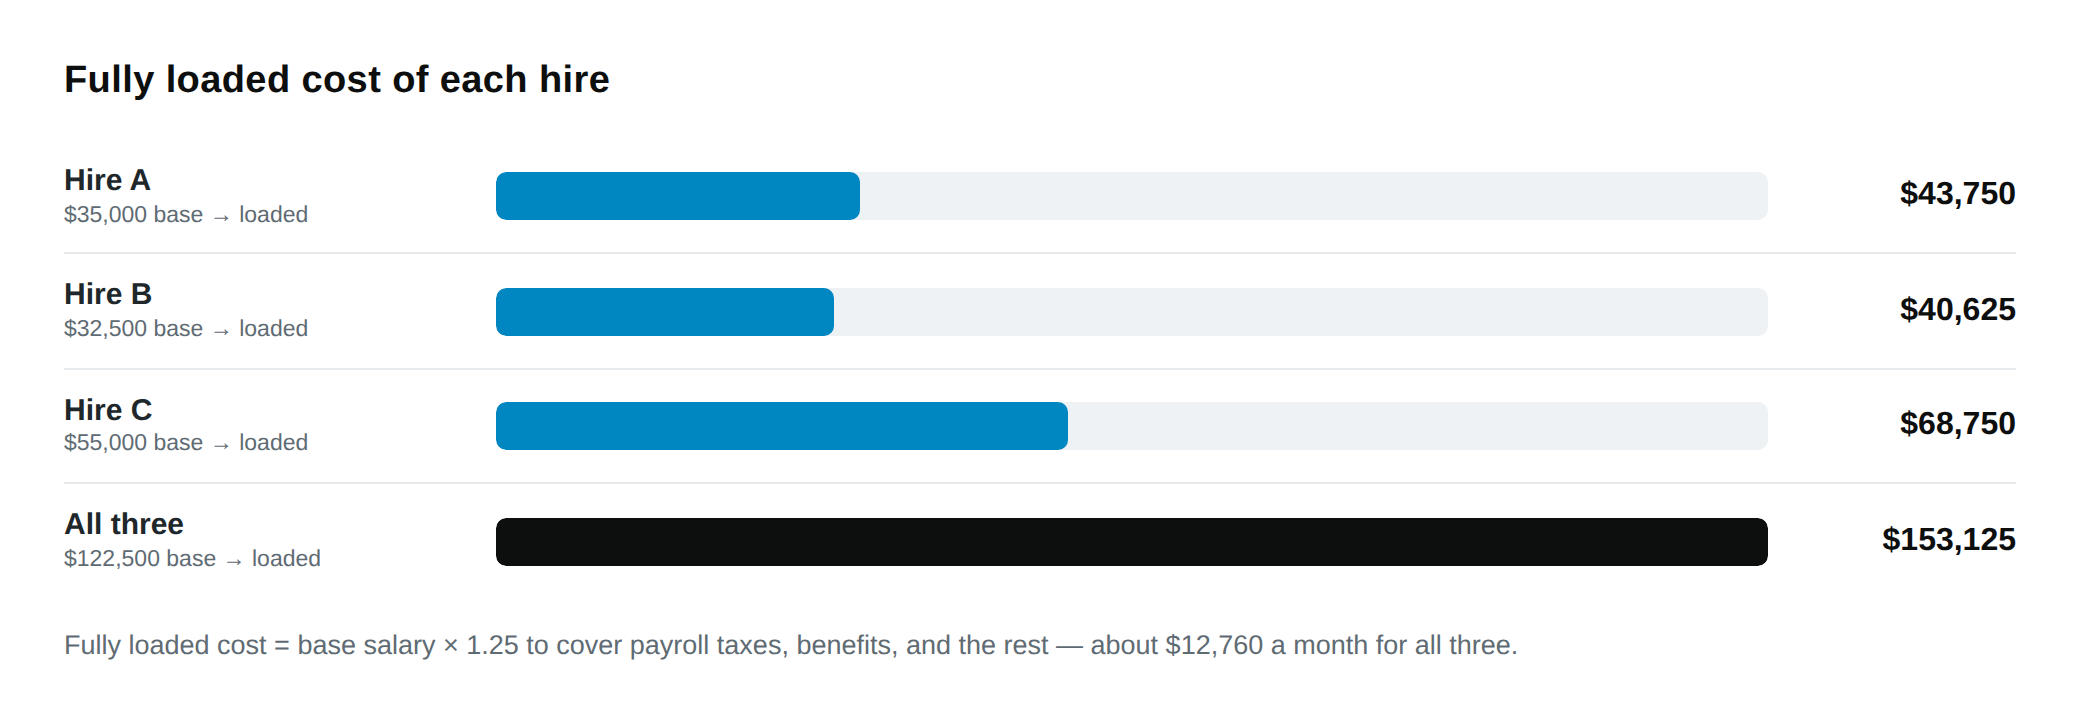
That is the agency’s fixed, at-risk commitment: approximately $12,760 a month that the agency owes whether the new hires produce anything or not. Against current monthly net income of approximately $18,153, the agency can carry that commitment, but the cushion becomes much thinner while the hires ramp up.
Producer commissions were not included because commission terms vary by agency, so we modeled gross production before producer commissions. That does not change the downside analysis, since no production means no commission expense. It does matter when evaluating profitability at higher production levels. Loaded base tells us whether the agency can afford the hires if production is delayed. Base plus commission tells us how profitable the producer roles are once production begins.
The Scenarios
What the hires would need to produce
The next step was testing how the financial picture changes as production increases. We modeled four gross production outcomes based on each hire’s loaded cost:
- 0x production: The hire generates no additional revenue.
- 1.5x production: The hire generates revenue equal to 1.5 times their loaded cost.
- 2.5x production: The hire generates 2.5 times their loaded cost.
- 4.0x production: The hire generates 4 times their loaded cost.
These scenarios measure gross production before producer commissions. That does not change the downside case. If the agency hires all three and they generate no additional revenue, recurring net income falls from approximately $217,831 to $64,706 a year, or about $5,392 a month. With no new production, there is no commission expense.
The agency remains profitable, but the cushion becomes much thinner. There is less room for a weak month, an unexpected expense, or continued owner distributions at the current pace.
Commissions matter more as production rises. The original 1.5x, 2.5x, and 4.0x projections show gross revenue before producer commissions, so the agency’s actual net income would be lower than those figures suggest. The exact impact depends on the agency’s commission structure.
Even with that limitation, the model answers the main affordability question clearly. The agency can support all three hires on paper, but taking them on at once creates a meaningful fixed commitment before the production shows up.
The Risk
The yellow flag sits in the cash flow
If there is a caution in this analysis, it sits in the cash flow statement rather than the P&L. Cash on hand fell from $153,677 on January 1 to $96,399 by May 31. The business remained profitable, but $403,591 in owner distributions, along with debt paydown, outpaced net income for the period.
That does not mean the agency cannot hire. It means the timing of the hires and the distribution strategy need to be considered together.
March also produced a small loss because of higher operating expenses, including travel and insurance. Revenue did not collapse, but the month shows how quickly the cushion could narrow after adding $12,760 in recurring fixed payroll cost.
A few things we flagged directly:
- Lowest-risk entry: Hire A or Hire B alone carries the smallest downside if production lags, with loaded costs of $40,625 and $43,750.
- Hire C is the largest commitment. At $68,750 in loaded annual cost, Hire C creates the biggest drag if production is delayed. It also creates the greatest absolute upside once the role begins producing.
- Treat the carrier bonus as contingency The $29,445 should serve as a buffer rather than a source of salary coverage.
- All three at once is survivable but tight The agency remains profitable in the downside scenario, but the cash position would require close attention, particularly if the existing distribution pattern continues.
What we recommended
The recommendation was to sequence the hires rather than treating the decision as a simple yes or no.
- Start with Hire A and/or Hire B since their loaded costs are the lowest and the downside is limited if production takes time to build.
- Set a clear production target, with production goals for the producers that reflect the agency’s commission structure and operating goals for the service role.
- Add Hire C once the first hires are proving out, or immediately if the role steps into a defined revenue-generating seat.
- Re-run the model at quarter-end against actuals, so the decision keeps pace with reality instead of a spring snapshot.
“I came in asking whether I could afford one hire. I left knowing I could afford all three, and exactly what each of them needs to produce.”
Why We Do This
Why we do this work
Most agency owners already have an accountant. We see that as the starting point.
Financial reporting tells you what happened. CFO advisory helps you use those numbers to decide what happens next.
An analysis like this is not meant to make the hiring decision for the owner. It shows how much the agency can commit, how long it can carry the cost, what each hire needs to produce, and where cash could become tight.
That gives the owner a decision based on the agency’s actual numbers rather than a gut read after a strong month.
This is part of our CFO advisory service for captive agencies. If you are weighing another hire, we can model the cost, production targets, and cash impact using your own agency’s results.
Want to see this for your agency?
We work with captive agency owners who want a real picture of what their next hire can support — before they make it.
Book a CFO ConsultationAll client data has been anonymized. Club Capital is an accounting, tax, and CFO advisory firm serving captive insurance agencies nationwide.
Comments